Microwave Amplifier Stability Numerical
1. Question
Consider a GaAs FET operating at 2 GHz with the following scattering parameters:
\[ S_{11}=0.894\angle-60.6^\circ \]
\[ S_{21}=3.122\angle123.6^\circ \]
\[ S_{12}=0.020\angle62.4^\circ \]
\[ S_{22}=0.781\angle-27.6^\circ \]
Find the Stabilty and draw Stability Circle if needed
Microwave transistor stability is one of the most important considerations in amplifier design. Before a transistor can be used in a microwave amplifier, it is necessary to determine whether it will remain stable for all possible passive source and load impedances. An unstable transistor can produce unwanted oscillations, resulting in amplifier malfunction, signal distortion, and interference with other frequency bands. For this reason, stability analysis is always performed before gain, matching, or noise optimization.
The objective is to determine whether the transistor is unconditionally stable or conditionally stable. This will be accomplished by evaluating the determinant of the S-matrix, calculating the Rollet stability factor K, calculating the μ-stability factor, and finally constructing the input and output stability circles.
2. Calculation of S-Matrix Determinant
2.1 Determinant of the S-Matrix
The determinant of the transistor scattering matrix is defined as:
\[ \Delta=S_{11}S_{22}-S_{12}S_{21} \]
Substituting the given S-parameters gives:
\[ \Delta=0.696\angle-83^\circ \]
Therefore, the magnitude of the determinant becomes:
\[ |\Delta|=0.696 \]
2.2 Physical Significance of Δ
The parameter Δ represents the determinant of the transistor S-matrix and plays a central role in stability analysis. It combines the effects of input reflection, output reflection, forward transmission, and reverse transmission into a single quantity. The value of Δ appears directly in the equations for stability circles, Rollet's stability factor, and the μ-test. For a transistor to satisfy the standard K-Δ unconditional stability criterion, the magnitude of Δ must be less than unity.
3. Calculation of Rollet Stability Factor (K-Factor)
3.1 K-Factor Formula
Rollet's stability factor is calculated using:
\[ K= \frac{ 1-|S_{11}|^2-|S_{22}|^2+|\Delta|^2 }{ 2|S_{12}S_{21}| } \]
Substituting the given values yields:
\[ K=0.607 \]
3.2 Interpretation of the Result
The Rollet factor is less than unity. This immediately indicates that the transistor does not satisfy the conditions required for unconditional stability. However, the K-factor alone cannot fully determine stability. It must always be evaluated together with the determinant magnitude |\Delta|.
4. Complete Interpretation of the K-Δ Stability Test
4.1 Conditions for Unconditional Stability
The K-Δ stability criterion requires two conditions to be satisfied simultaneously:
\[ K>1 \]
\[ |\Delta|<1 \]
Only when both conditions are true can the transistor be classified as unconditionally stable.
4.2 Interpretation of All Possible Cases
| Condition | Stability Classification |
|---|---|
| \(K>1\) and \(|\Delta|<1\) | Unconditionally Stable |
| \(K<1\) and \(|\Delta|<1\) | Conditionally Stable (Potentially Unstable) |
| \(K>1\) and \(|\Delta|>1\) | Not Unconditionally Stable |
| \(K<1\) and \(|\Delta|>1\) | Potentially Unstable |
For the present transistor:
\[ K=0.607 \]
\[ |\Delta|=0.696 \]
Although |\Delta| satisfies the required condition, the K-factor does not. Therefore, the transistor is not unconditionally stable and must be regarded as conditionally stable or potentially unstable.
5. μ-Stability Factor
5.1 μ-Test Formula
An alternative test for unconditional stability is the μ-test:
\[ \mu= \frac{ 1-|S_{11}|^2 } { |S_{22}-\Delta S_{11}^{*}|+|S_{12}S_{21}| } \]
Substituting the given S-parameters gives:
\[ \mu=0.861 \]
5.2 Interpretation of μ
| μ Value | Interpretation |
|---|---|
| \(\mu>1\) | Unconditionally Stable |
| \(\mu=1\) | Stability Boundary |
| \(\mu<1\) | Conditionally Stable / Potentially Unstable |
Since μ is less than unity, the transistor again fails the unconditional stability requirement. However, because μ is relatively close to unity, the device is close to becoming unconditionally stable. This indicates that only a limited region of source and load impedances may produce instability.
Larger values of μ correspond to larger stability margins. A device with μ equal to 2 possesses significantly greater stability margin than a device with μ equal to 1.05.
6. Decision: Should Stability Circles Be Constructed?
6.1 When Stability Circles Are Required
Stability circles should be calculated whenever the transistor is not proven to be unconditionally stable. This occurs if any of the following conditions exist:
\[ K<1 \]
\[ |\Delta|>1 \]
\[ \mu<1 \]
Under these circumstances, stable and unstable regions must be identified on the Smith Chart before designing the matching networks.
6.2 When Stability Circles Are Usually Not Required
If the transistor satisfies:
\[ K>1 \]
\[ |\Delta|<1 \]
or equivalently:
\[ \mu>1 \]
the device is unconditionally stable for all passive source and load impedances. In such situations, calculating the stability-circle parameters is generally unnecessary unless the objective is educational demonstration or graphical verification.
\[ C_L,\;R_L,\;C_S,\;R_S \]
7. Output Stability Circle Calculation
7.1 Output Stability Circle Center
The center of the output stability circle is given by:
\[ C_L= \frac{ (S_{22}-\Delta S_{11}^{*})^{*} } { |S_{22}|^2-|\Delta|^2 } \]
Substituting the transistor parameters:
\[ C_L=1.361\angle47^\circ \]
7.2 Output Stability Circle Radius
\[ R_L= \frac{ |S_{12}S_{21}| } { |S_{22}|^2-|\Delta|^2 } \]
\[ R_L=0.5 \]
The output stability circle divides the load Smith Chart into stable and unstable regions. Any load reflection coefficient chosen outside the stable region may lead to oscillation.
8. Input Stability Circle Calculation
8.1 Input Stability Circle Center
\[ C_S= \frac{ (S_{11}-\Delta S_{22}^{*})^{*} } { |S_{11}|^2-|\Delta|^2 } \]
\[ C_S=1.131\angle68^\circ \]
8.2 Input Stability Circle Radius
\[ R_S= \frac{ |S_{12}S_{21}| } { |S_{11}|^2-|\Delta|^2 } \]
\[ R_S=0.199 \]
The input stability circle separates source reflection coefficients that produce stable operation from those that can potentially cause oscillation. When designing the input matching network, the selected source impedance must lie within the stable region identified by this circle.
IN SMITH CHART
Step 1: Measure the Smith Chart Radius
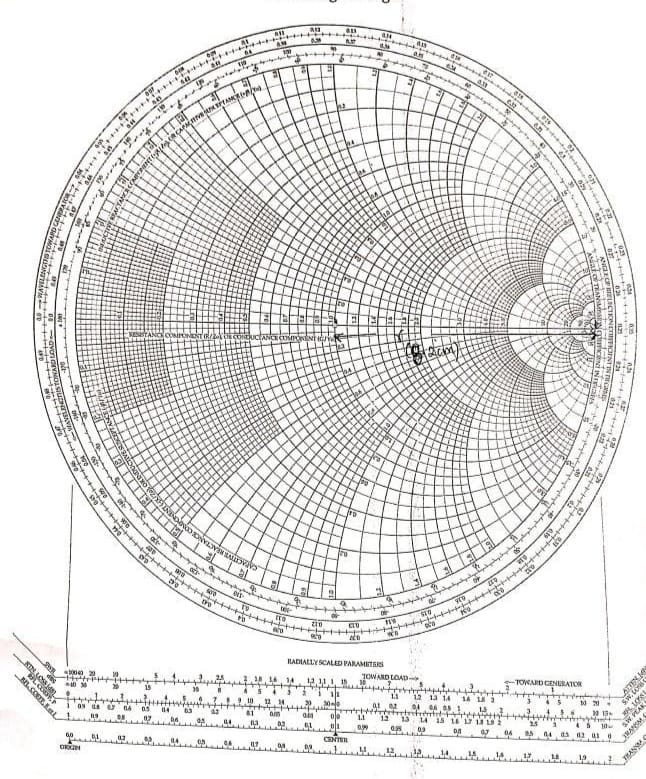
Measure the physical radius (r) of the Smith chart from the center to the outer perimeter using a ruler.
-
Value: r = 8.2 cm
-
Verification: Confirm the measurement matches the outer circumference zero-reflection point.
Step 2: Draw stability circle for load
Plot the Output Stability Circle (Load Plane)
Using the calculated output stability parameters (CL = 1.361∠47° and RL = 0.5):
-
Angle Line: Draw a line from the center of the Smith chart outward at an angle of 47° using the outer angle scale ("Angle of Reflection Coefficient in Degrees").
-
Center Location: Multiply the magnitude of CL by the chart radius (1.361X8.2 cm = 11.16 cm) and mark the center point CL along the 47° line.
-
Circle Radius: Calculate the compass opening for the radius (0.5 X 8.2 cm = 4.1cm).
-
Draw Circle: Place the compass needle at point CL and draw the output stability circle with radius 4.1 cm.
-
Verification: Ensure the circle intersects the proper regions of the Smith chart corresponding to the normalized impedance plane.
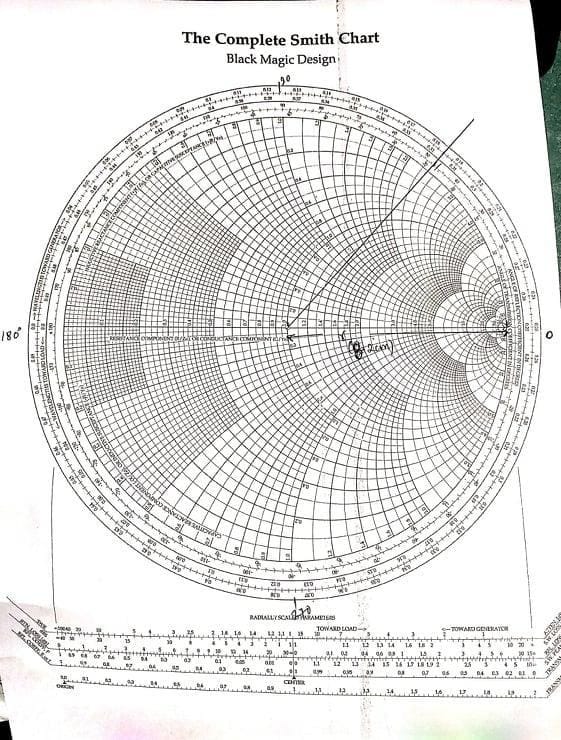
Draw the circle with pivot point as CL
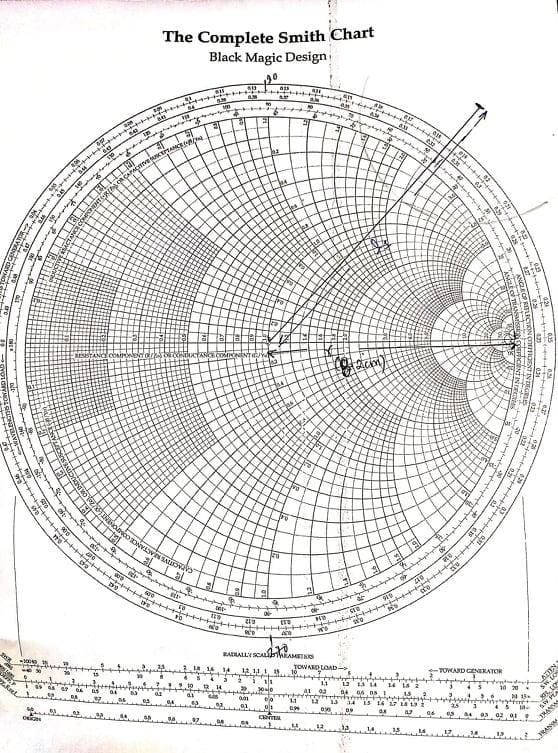
Plot value for radius RL = 0.5 * r = 4.1cm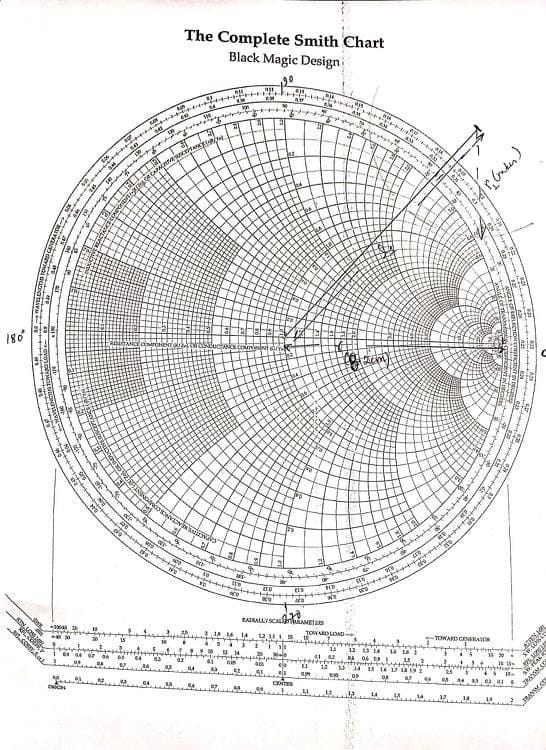
Step 3: Draw Stability circle for source too
Plot the Input Stability Circle (Source Plane)
Using the calculated input stability parameters (CS = 1.131∠68° and RS =0.199):
-
Angle Line: Draw a line from the center of the chart outward at an angle of 68 degree using the outer perimeter scale.
-
Center Location: Compute the scaled distance for the source center (1.131 X 8.2 cm = 9.27 cm) and mark point Cs along the 68° line.
-
Circle Radius: Compute the compass opening for the radius (0.199 X 8.2 cm = 1.63 cm).
-
Draw Circle: Place the compass needle at point CS and draw the input stability circle.
-
Verification: Check that both circle centers and radii match the calculated values from your design metrics.
Plot Load line here angle is 68 degrees
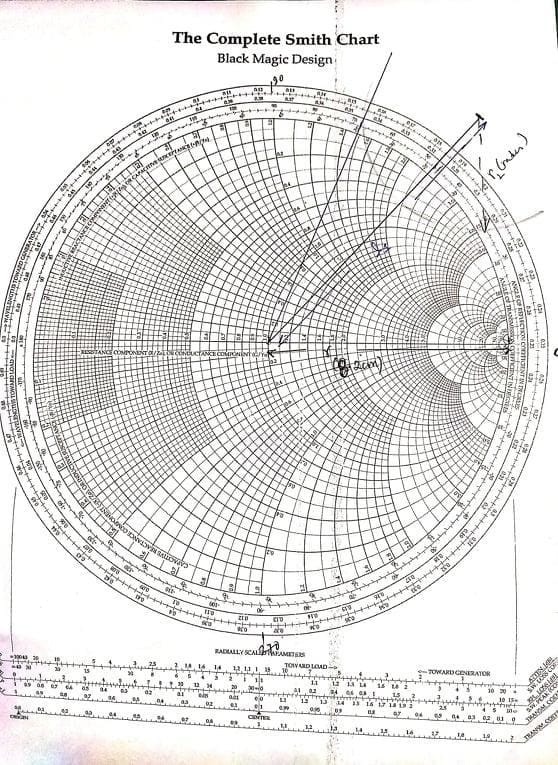
Plot length and radius
Length = 1.131 *r = 9.274
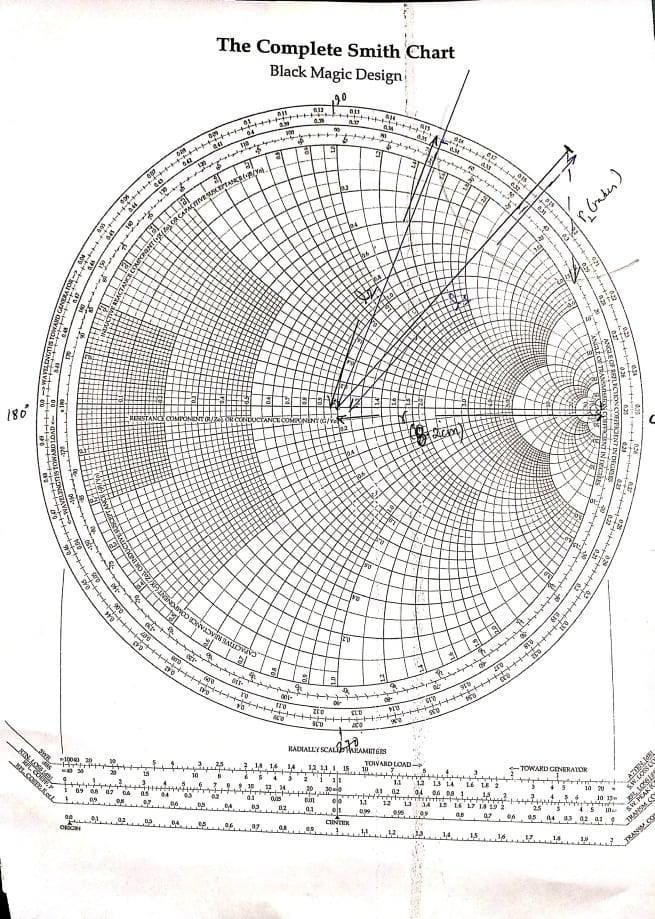
Plot radius of stability circle
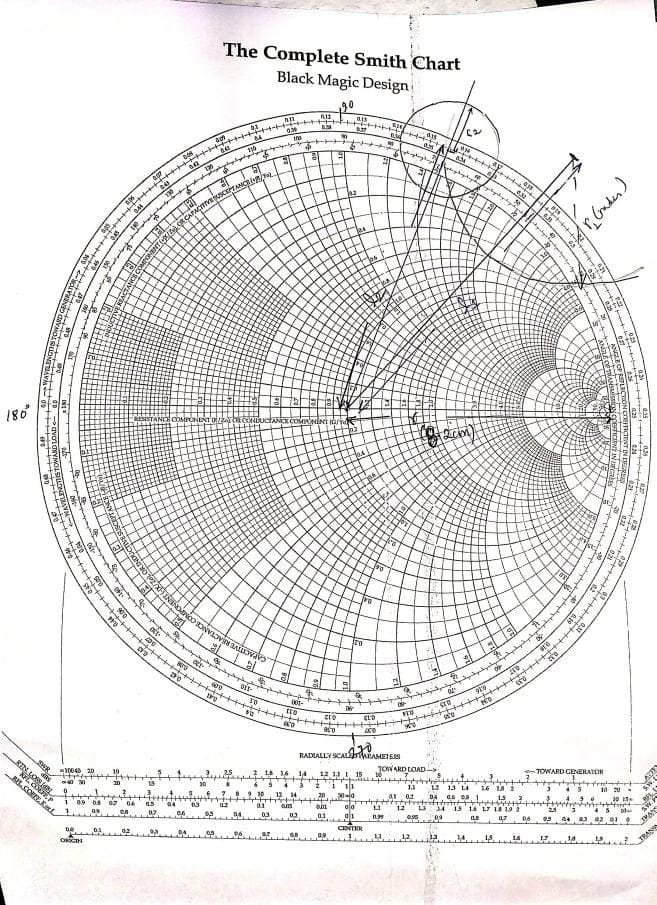
Step 5: Define Stability Parameters according to conditions
Identify the safe operating regions by checking whether |S11| or |S22| is less than 1 to shade the permitted regions for ΓS and ΓL
Verification: Confirm that the stable load and source reflection coefficient areas are clearly marked outside or inside the respective circles based on the device's potential instability. 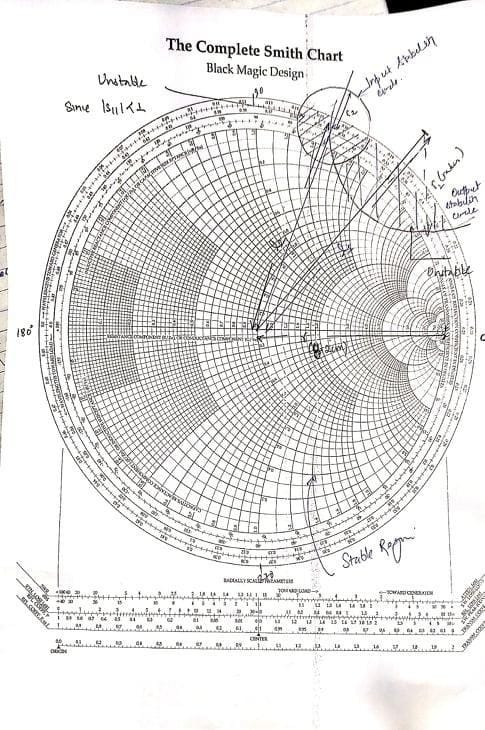
9. Final Stability Assessment
9.1 Interpretation of K-Factor Result
The calculated value of K equals 0.607, which is less than unity. Therefore, the transistor does not satisfy Rollet's unconditional stability criterion.
9.2 Interpretation of μ-Factor Result
The calculated value of μ equals 0.861. Since μ is less than one, the transistor again fails the unconditional stability test. However, because μ is relatively close to unity, the device is near the stability boundary.
9.3 Stability Classification
The transistor is classified as conditionally stable or potentially unstable. Stable operation is possible, but only for certain source and load impedances.
9.4 Why Stability Circles Are Necessary
Since the transistor is not unconditionally stable, the designer cannot assume that every passive impedance will result in stable operation. The stability circles must therefore be plotted to identify safe regions on the Smith Chart before matching-network design begins.
The calculated values of K, Δ, μ, and the stability-circle parameters show that the GaAs FET is potentially unstable at 2 GHz. Consequently, source and load matching networks must be selected carefully so that the resulting reflection coefficients remain within the stable regions identified by the input and output stability circles. This example demonstrates the complete procedure for microwave transistor stability analysis using the K-Δ test, μ-test, and stability-circle method.